Academic and postgraduate surveys
An Academic & Postgraduate Research survey is built for Master's and PhD work. Your questionnaire becomes a full analysis environment: reliability, descriptive tables in APA 7th style, factor analysis, correlation, regression and hypothesis tests, all computed automatically from the answers you collect, with no manual data entry into a statistics program.
Note The examples on this page come from a sample study of university students' engagement and achievement (300 respondents). The data is generated for demonstration and isn't real.
What you get
| Analysis | What it tells you |
|---|---|
| Cronbach's alpha per construct, and alpha if item deleted | Whether your items measure one thing, and which item weakens a scale |
| Reliability within each group | Whether the scale holds for men and women, each year, and so on |
| APA 7th descriptive tables | Means, standard deviations, relative weight and rank, ready for your thesis |
| Normality checks | Skewness, kurtosis, Shapiro-Wilk and Kolmogorov-Smirnov, to choose the right test |
| Exploratory factor analysis | KMO, Bartlett, eigenvalues and rotated loadings |
| Correlation matrix | Pearson or Spearman, chosen from normality, with Bonferroni correction |
| Multiple linear regression | R², β, VIF, Durbin-Watson and the checks behind them |
| Differences between groups | t-test, Welch, ANOVA with post-hoc, Mann-Whitney and Kruskal-Wallis, with effect sizes |
| Pre/post test | Paired t-test between two waves of the same people. See Pre/post surveys |
| Export for SPSS | Your data with a codebook, for anything you want to run yourself |
Prepare your survey for analysis
Four settings make the analysis work. Set them before you collect answers:
- Give every scale item a construct. In each rating question, fill in Construct / Study Dimension, such as "Behavioural engagement". Reliability and construct scores are built from it.
- Mark negatively worded items as reverse scored. For example, "I miss lectures without a good reason" in an engagement scale. Tick This item is reverse scored, or it will pull the scale's alpha down.
- Map gender and age, and choose the constructs making up the total score in Settings → Mapping.
- Choose your study design in Settings → Analysis & Tests, such as a correlational or causal-comparative study. The right tests are switched on for you.
See Create a survey and Survey settings.
Open the analysis
Open View Responses & Results and choose the Academic & Reliability (Cronbach) tab. At the top: Export for SPSS (.csv Codebook) and Print Report.
Reliability: Cronbach's alpha
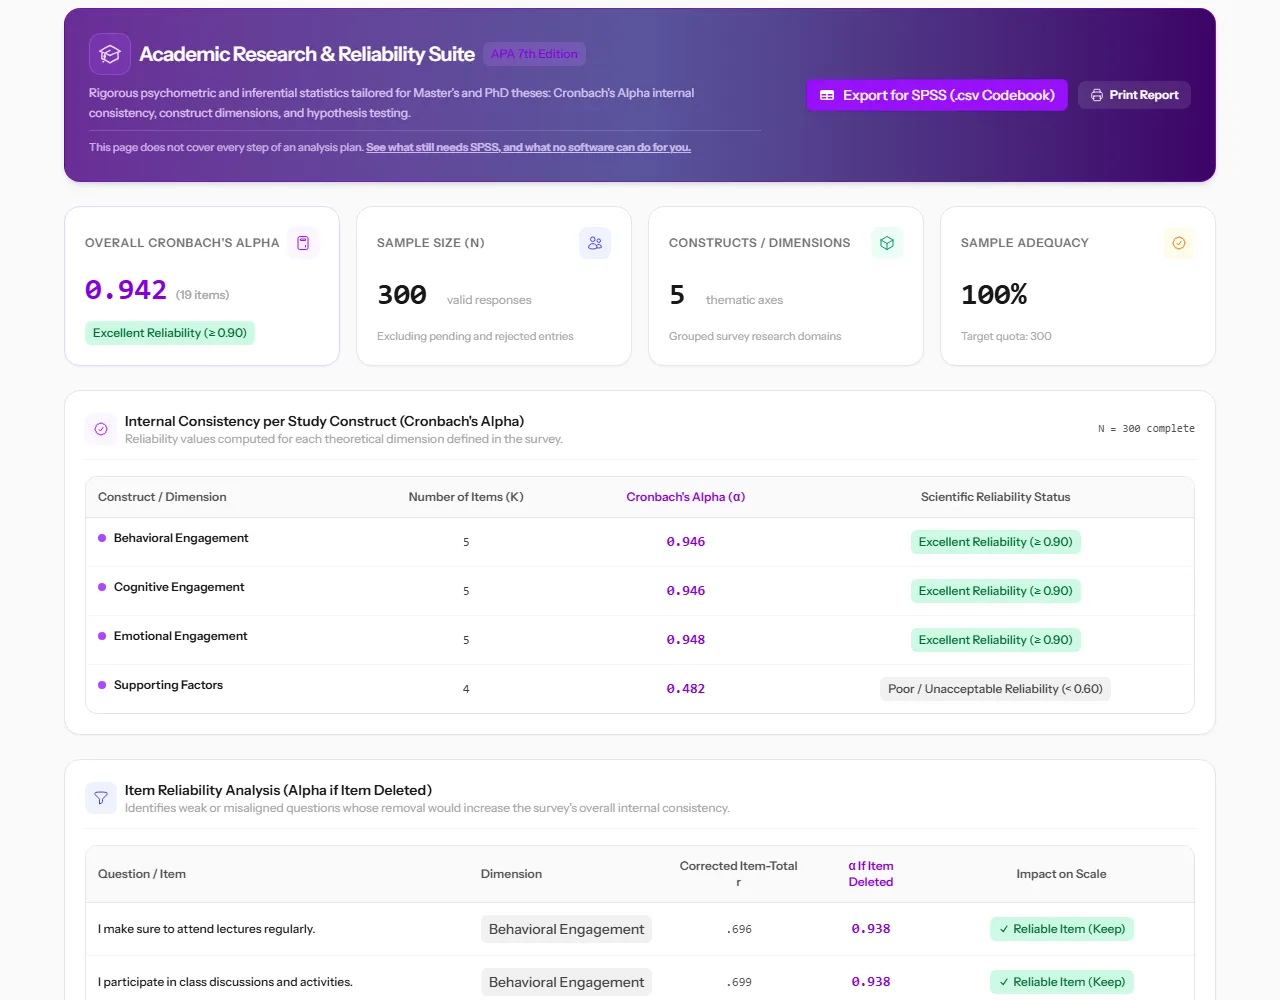 Three constructs show excellent reliability (0.946 to 0.948). "Supporting factors" fails at 0.482.
Each construct gets its alpha and a clear verdict, from Excellent (0.90 and above) to Poor / Unacceptable (under 0.60).
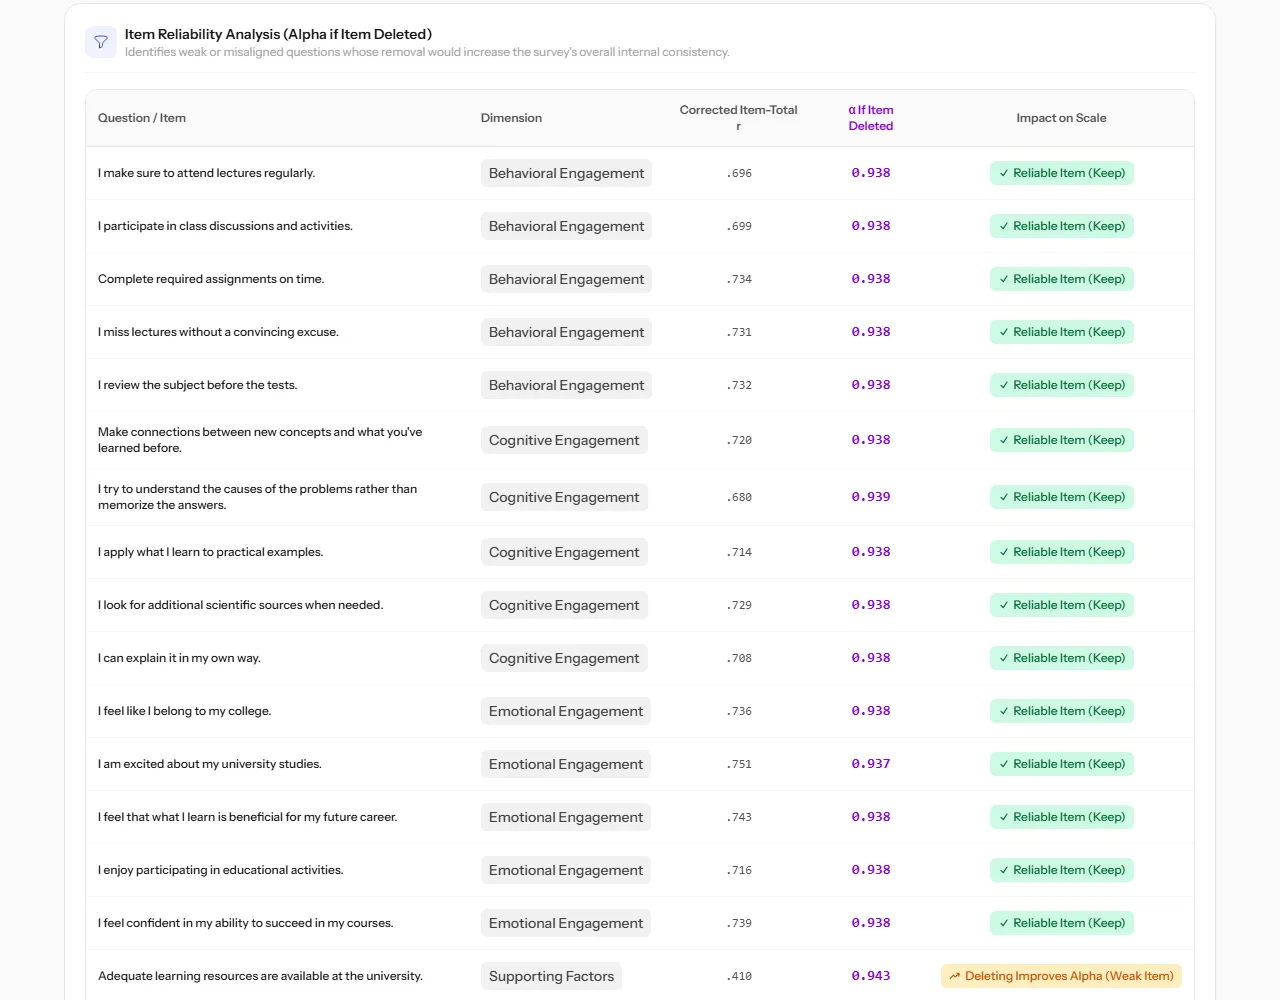
Below it, Item Reliability Analysis (Alpha if Item Deleted) shows each item's correlation with the rest of its scale, and what alpha would become without it. Items that weaken the scale are flagged Deleting Improves Alpha (Weak Item).
Descriptive statistics in APA style
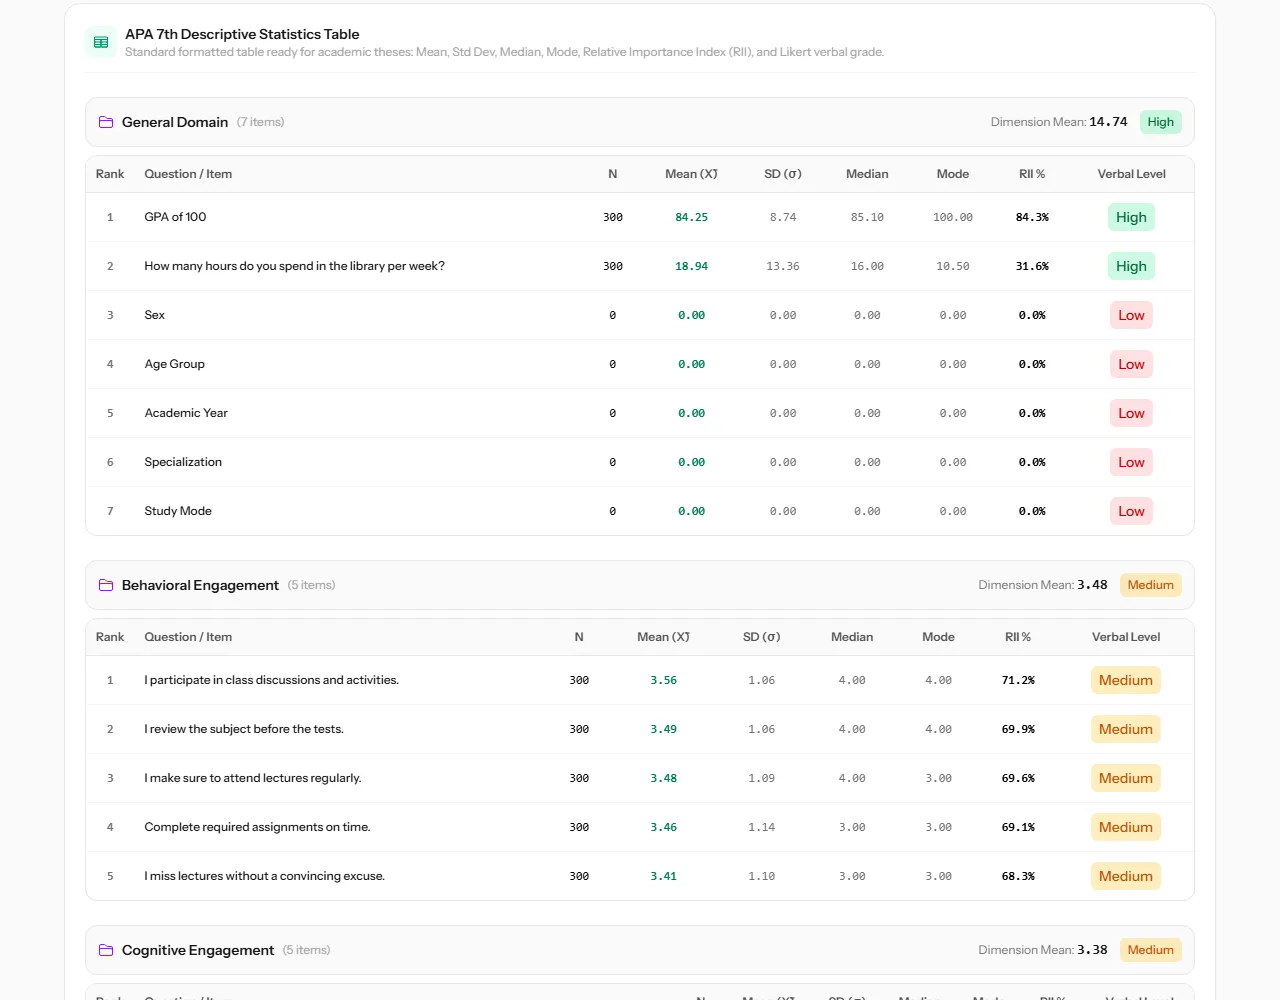 Mean, standard deviation, relative weight and rank for every item, grouped by construct.
The APA 7th Descriptive Statistics Table lists each construct and item with its mean, standard deviation, relative weight and level, ranked. It's laid out the way the results chapter of a thesis presents them.
Exploratory factor analysis
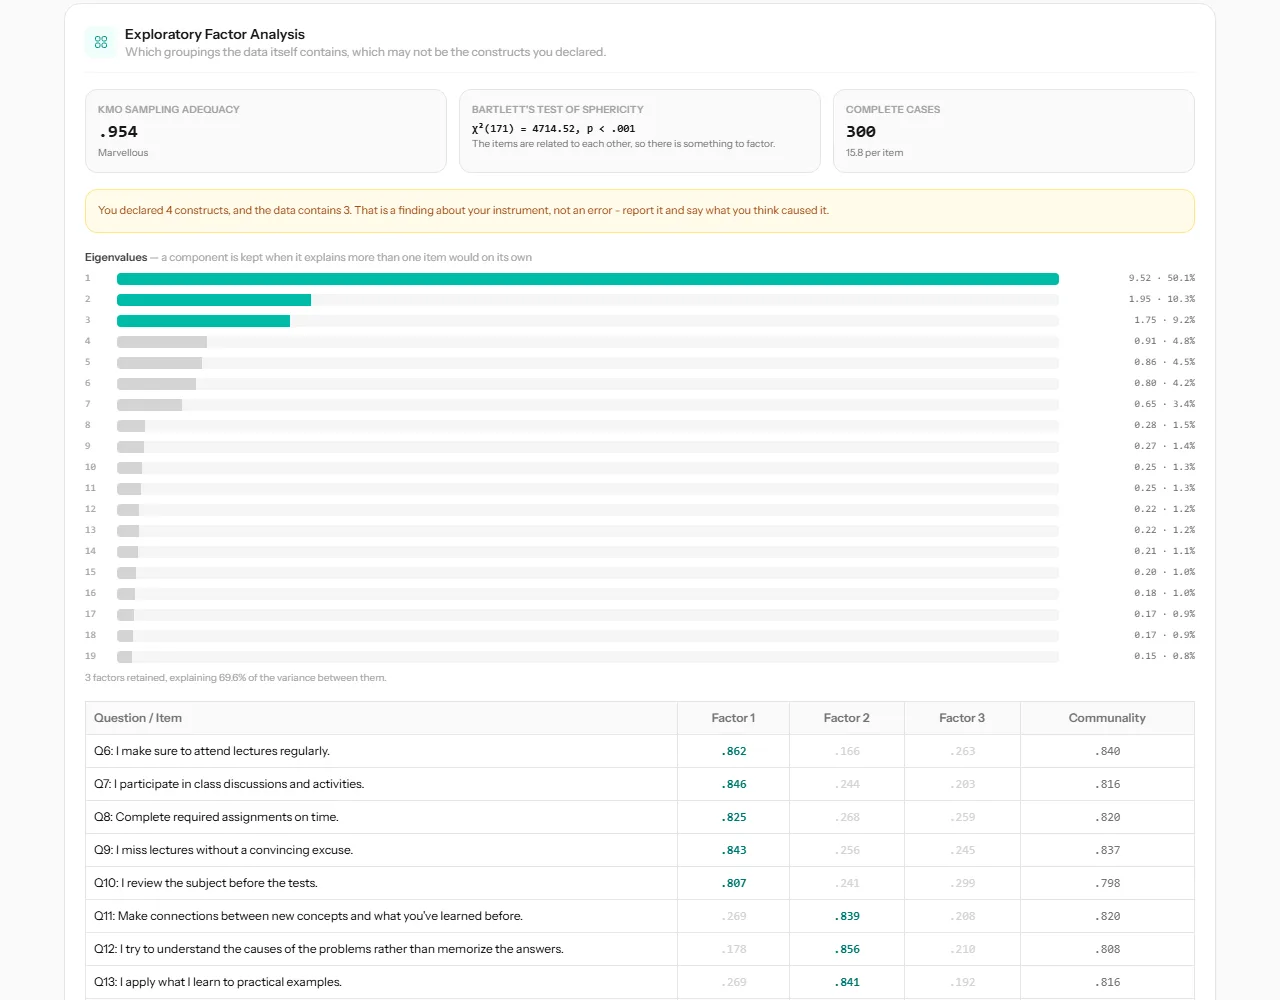 KMO and Bartlett first, then eigenvalues and rotated loadings.
Before extracting factors, Pulseform checks your data is suitable (KMO and Bartlett's test). It then shows the eigenvalues, how many factors to keep, and the varimax-rotated loadings of each item. That's how you show your items group into the constructs you designed.
Correlation
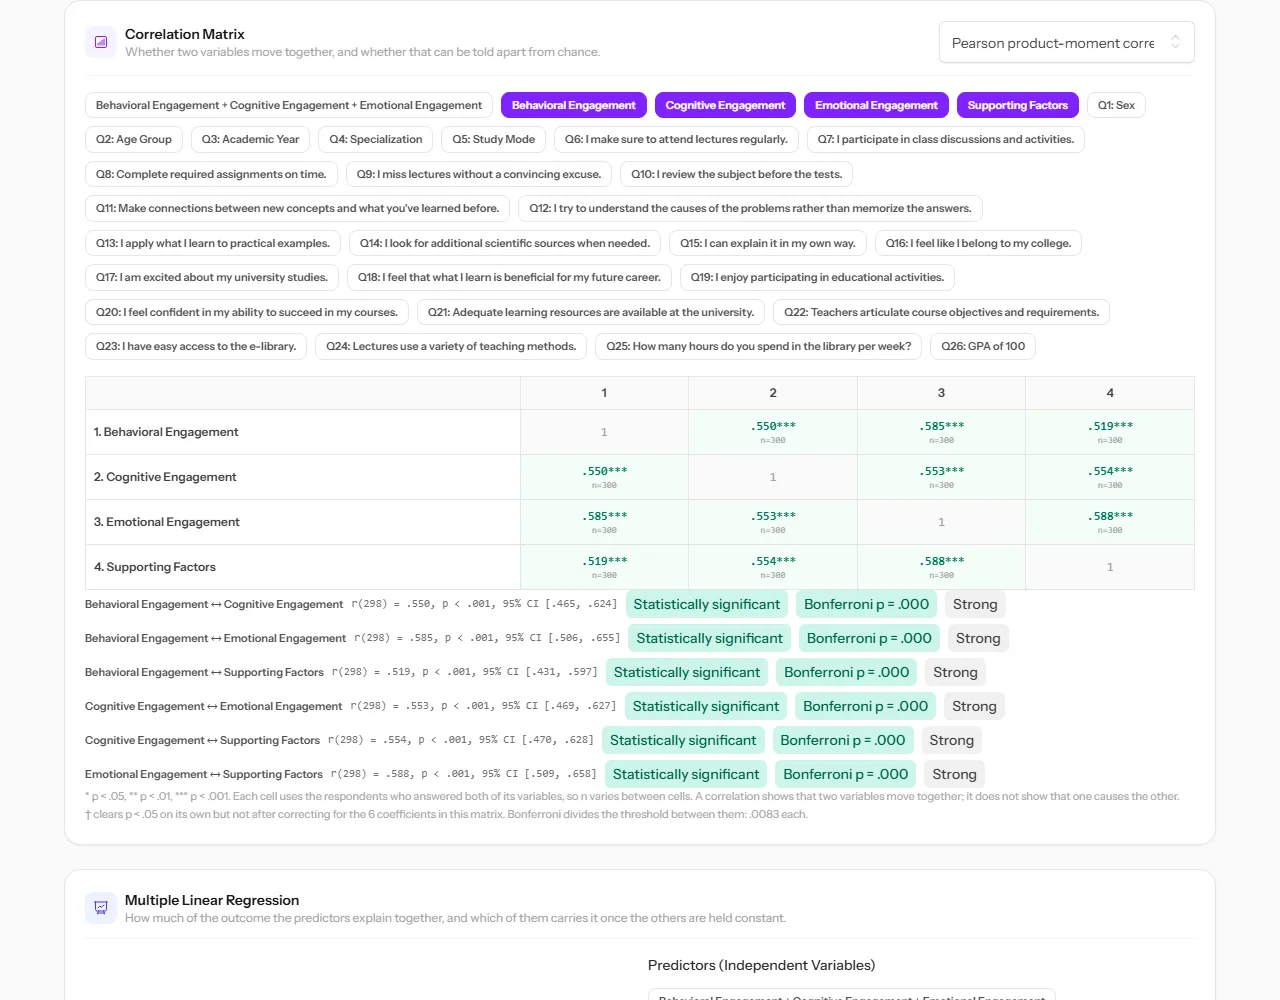
Choose the variables, constructs, the total score or single items, and get the matrix. Pulseform checks normality first and recommends Pearson or Spearman accordingly. It applies the Bonferroni correction across the matrix, and describes each correlation's strength.
Multiple regression
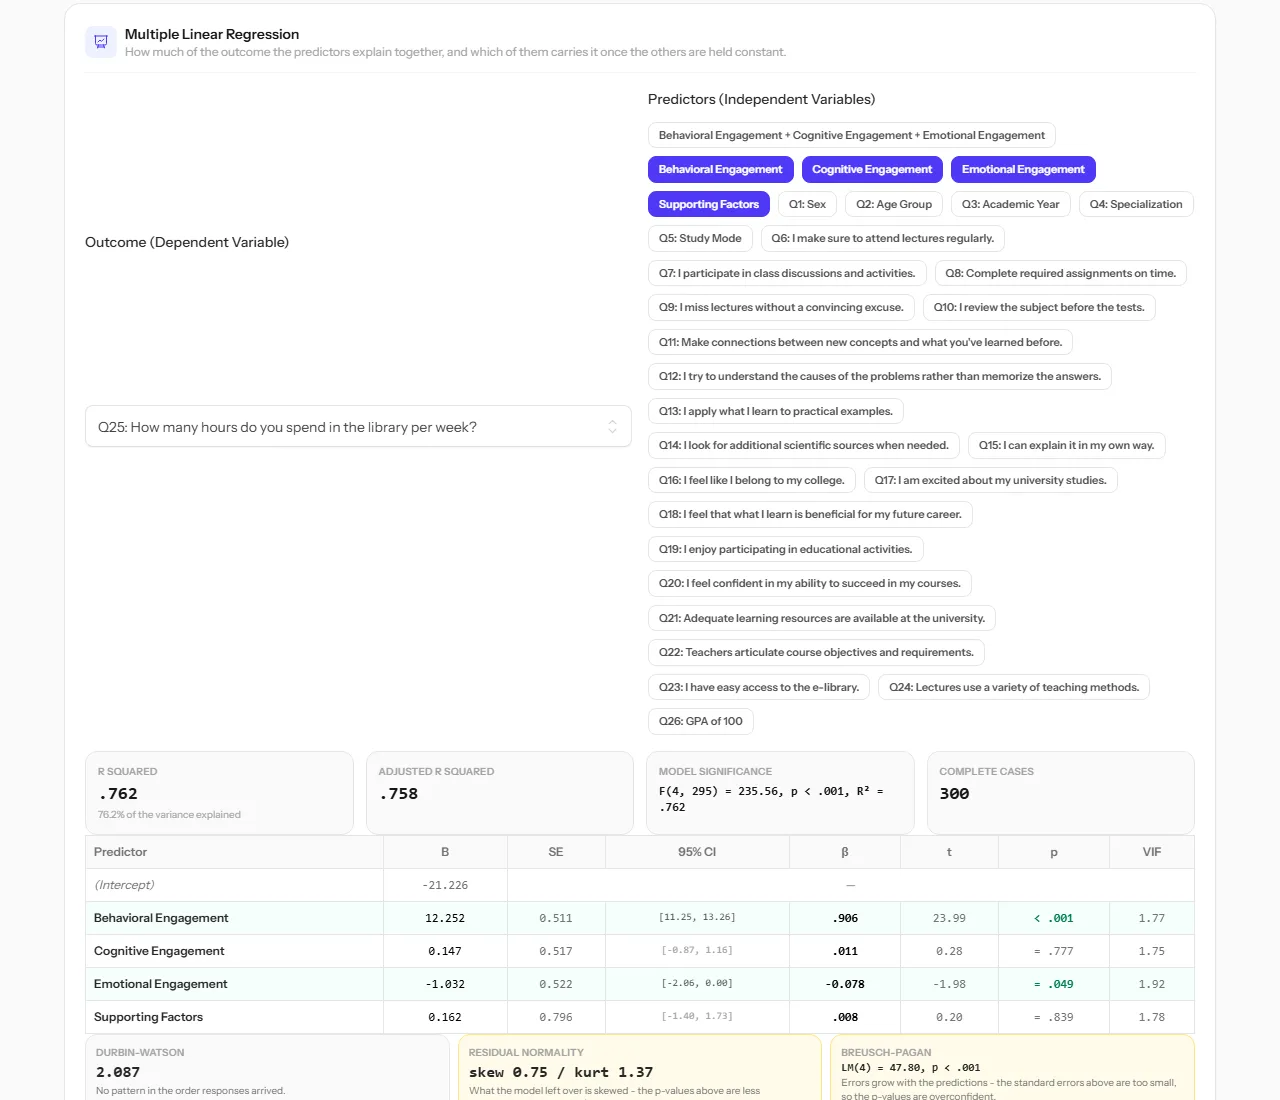 R² and β for each predictor, with the checks a reviewer will ask about.
Choose an outcome and its predictors. You get R², adjusted R², the model's significance, and for each predictor B, β, the 95% confidence interval, p and VIF.
Below the table, Pulseform checks the assumptions for you: Durbin-Watson, residual normality, and Breusch-Pagan. In this example it warns that the errors grow with the predictions, so the p-values are overconfident. That's exactly the kind of problem that's easy to miss by hand.
Differences between groups
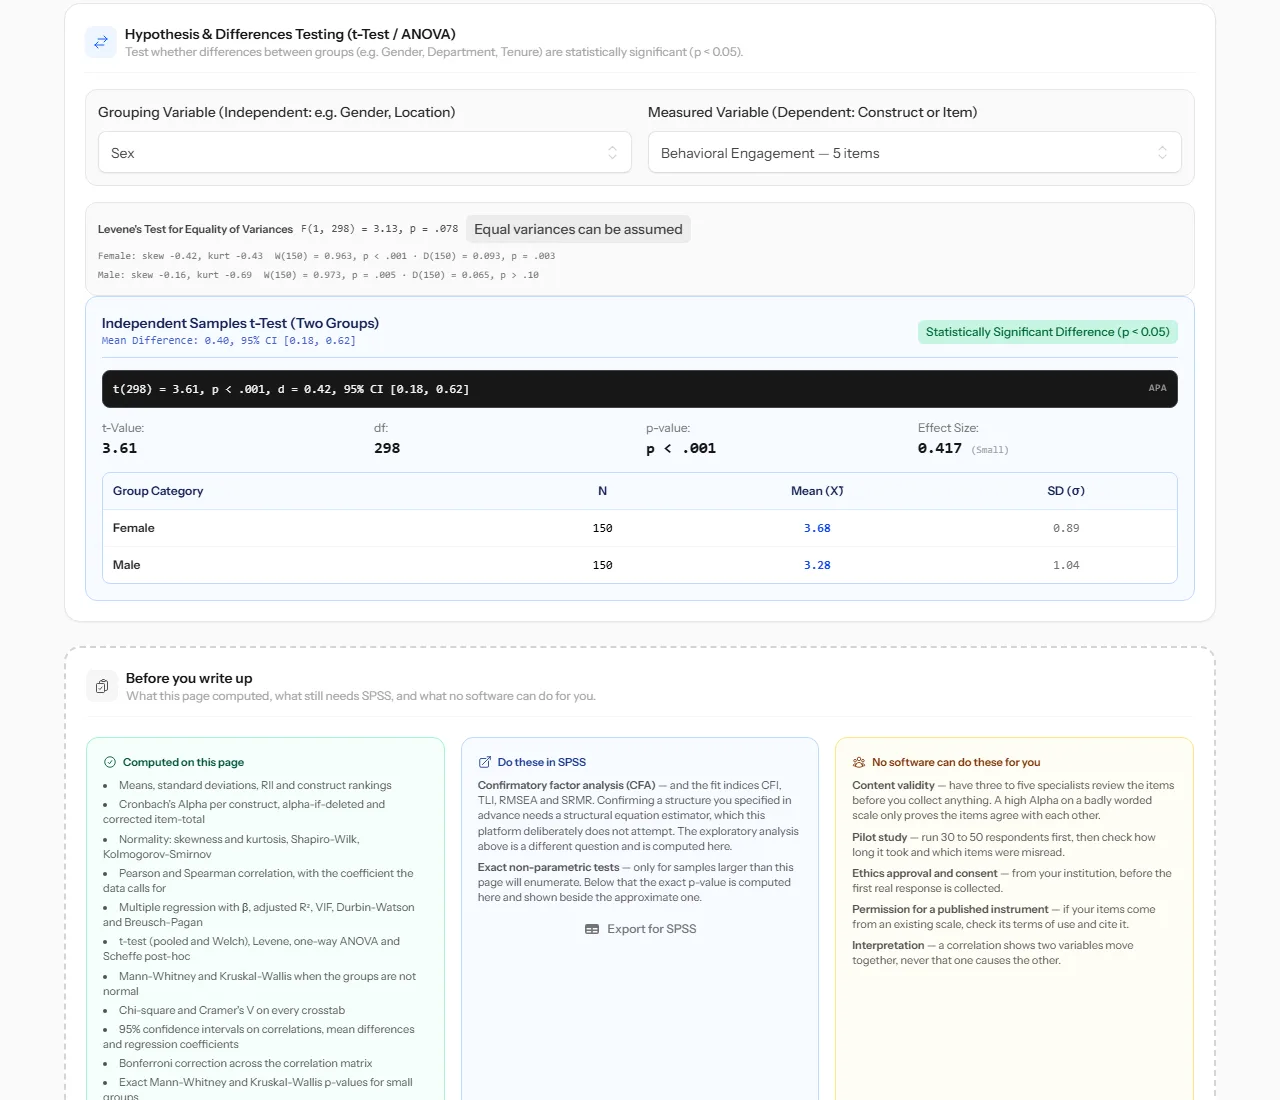 Behavioural engagement by gender: t(298) = 3.61, p < .001, d = 0.42.
Choose a grouping variable, such as gender or year of study, and a measured variable, such as a construct. Pulseform:
- checks equal variances with Levene's test, and uses Welch's test when needed,
- uses the t-test for two groups and ANOVA for more, with post-hoc comparisons to show which groups differ,
- switches to Mann-Whitney or Kruskal-Wallis when the data isn't normal, and computes exact p-values for small groups,
- reports the effect size, so you know whether a significant difference is also a meaningful one,
- writes the result as one APA line you can copy into your thesis.
Before you write up
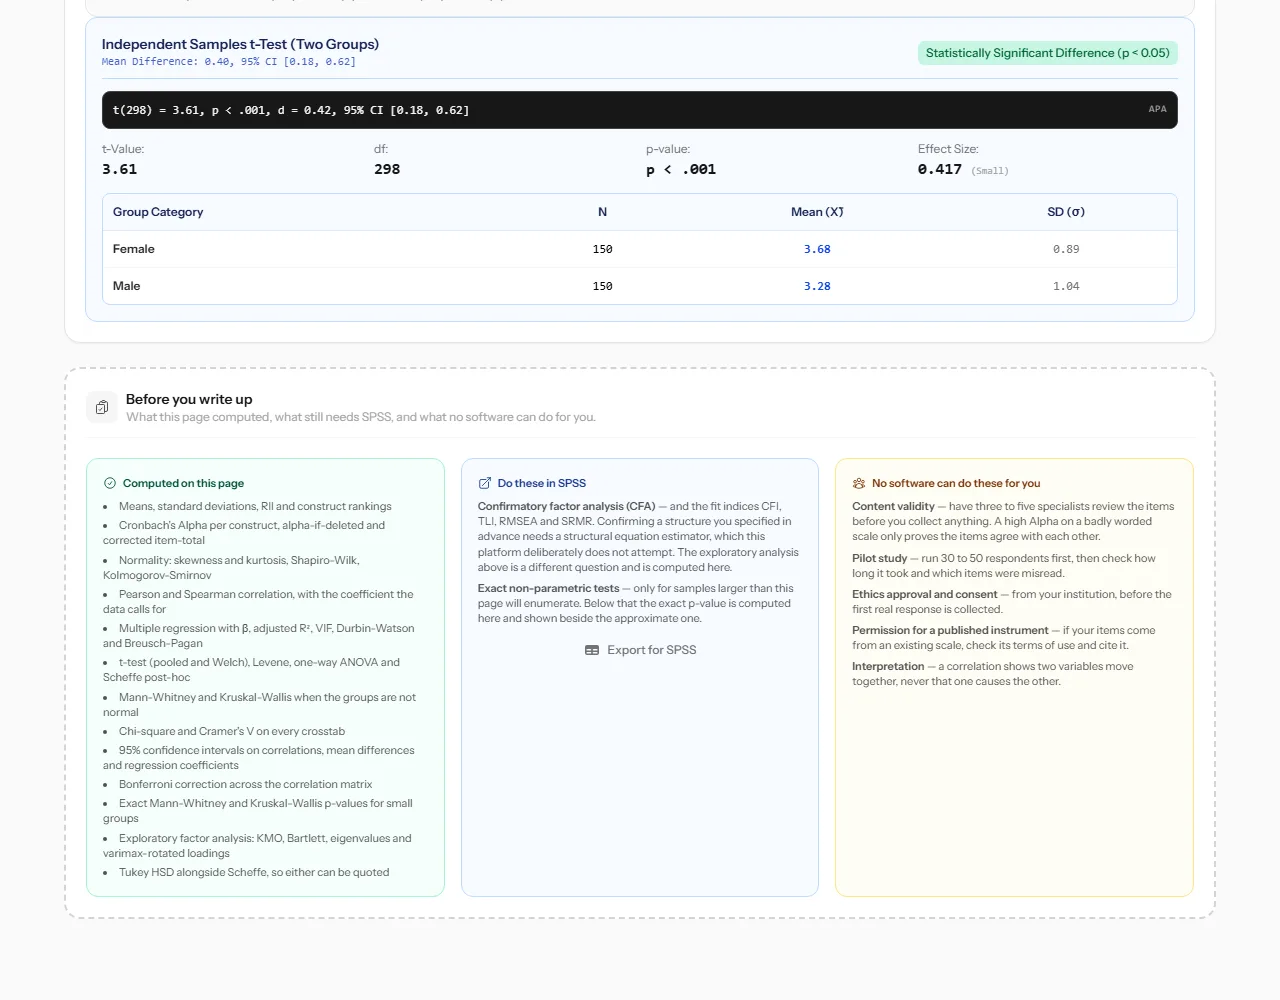
At the end of the page, Before you write up tells you honestly:
- Computed on this page: everything listed above.
- Do these in SPSS: for example confirmatory factor analysis (CFA), which Pulseform deliberately doesn't attempt. Use Export for SPSS.
- No software can do these for you: content validity by expert review, a pilot study, ethics approval, permission to use a published scale, and interpretation.
When Pulseform refuses to give a number
A statistic is only useful if the data supports it. When it doesn't, Pulseform says why instead of printing a misleading number.
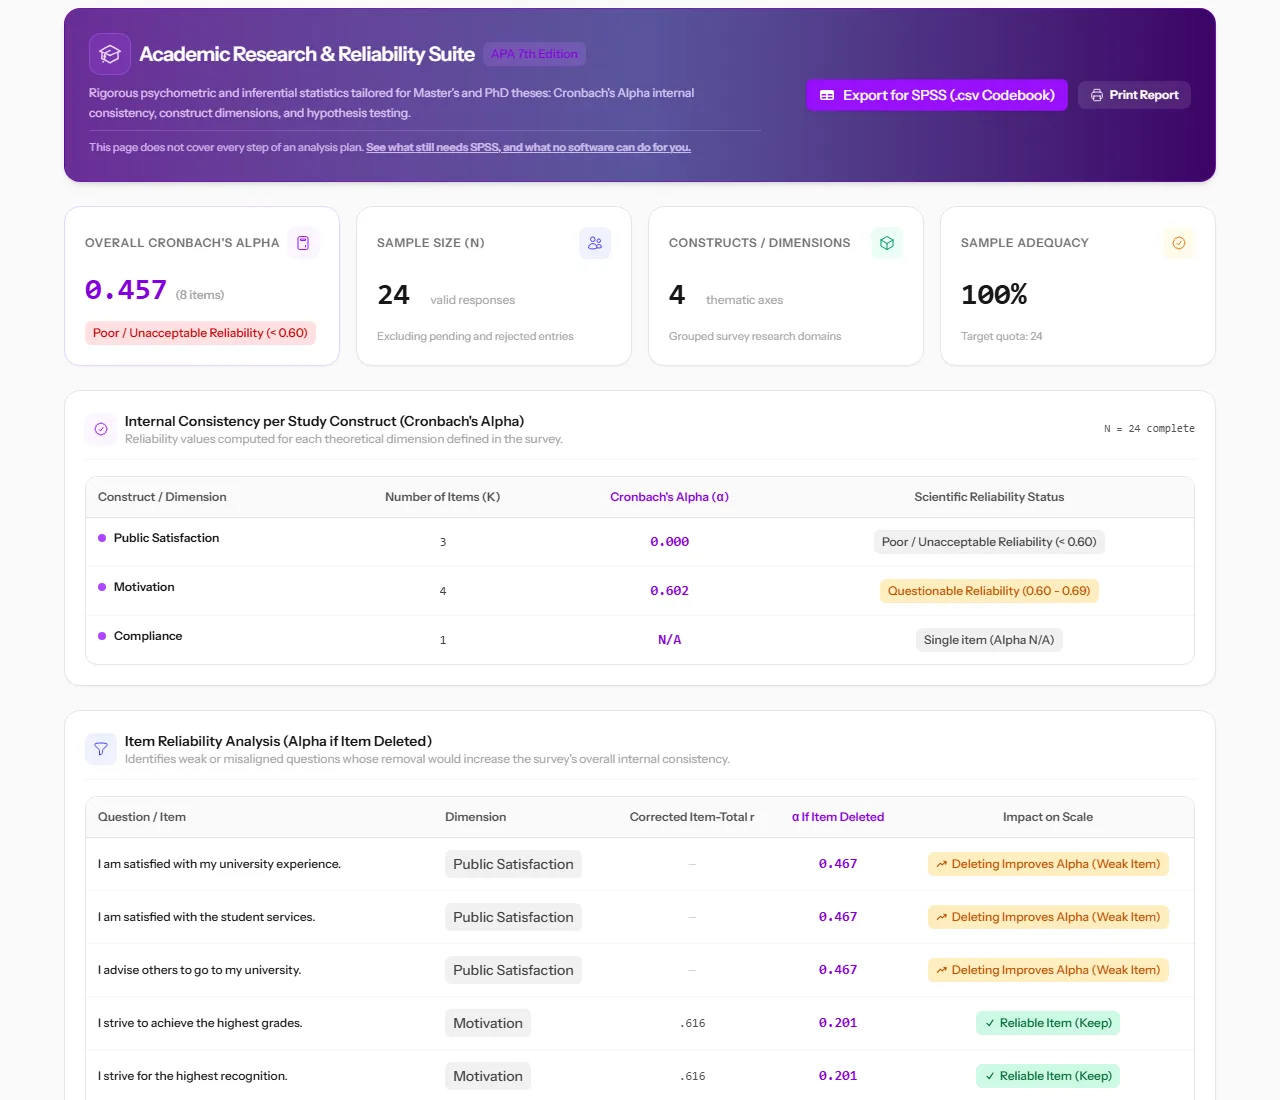 A deliberately flawed study: a construct with no variation, a single-item scale, and weak items flagged.
Examples you may see:
- a construct everyone answered the same way has no variance to measure,
- a scale with one item has no internal consistency (alpha N/A),
- a group of one person can't be compared,
- a cross-tab with too few answers per cell is too sparse for chi-square.
Tip Read these messages carefully. They usually point to a problem in the questionnaire or the sample that's worth mentioning in your thesis.
Next steps
- Practise on a ready-made study first: Read this report with me.
- Measure change over time with Pre/post surveys.
- Read Understand your survey results for a plain-language guide to the most common figures.